The newest addition to our collection of data is Research and Development Expenses (R&D), which we've included in all our tools as researchdev(day). For the most recent R&D expenses, use researchdev(1). For last year, use researchdev(252) since there are 252 trading days in a year.
We wanted a way to peer into new products or services a company might be offering in the future, and R&D fit the bill. Granted, not all R&D work will pan out, but if a company has enough money to be investing in its own future, that's a good sign, and can lead to new revenue streams.
Time to play!
Being able to see data really gets my curiosity juices flowing and asking the right questions. First step, Visualizer. I plugged in Microsoft and added the expression researchdev(1) to get started.

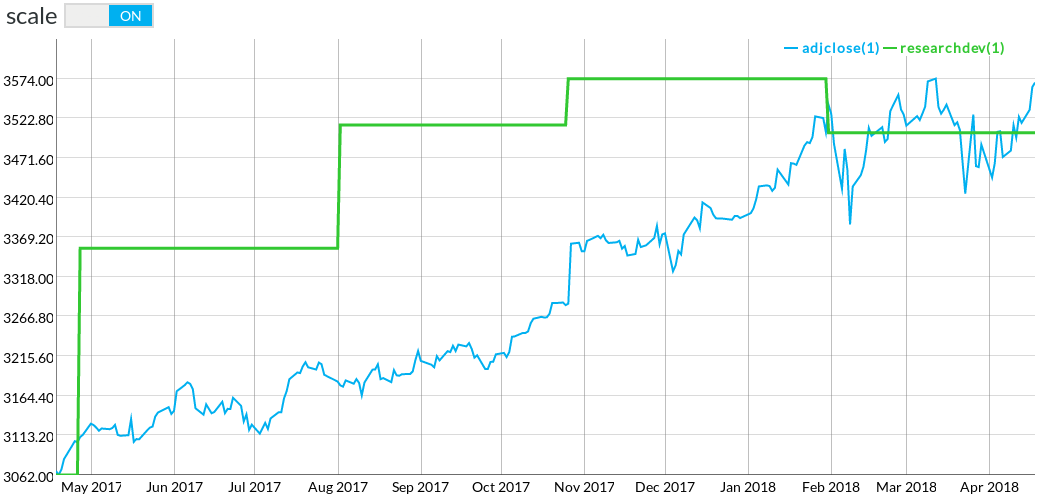
Interesting, there might be something to work with here. You can see a clear correlation between price and R&D, but then again, most everything was moving up through this time period, especially technology companies. That made me wonder, are certain sectors impacted more strongly by R&D spend? The next step in my exploration involved using Backtester in a rather novel way.
How R&D affects sectors
Backtester is an exceptionally powerful tool. Not only can it simulate specific investment strategies, it can also be used to approximate industry or sector averages. Here's the strategy I plugged in to Backtester to do my analysis.
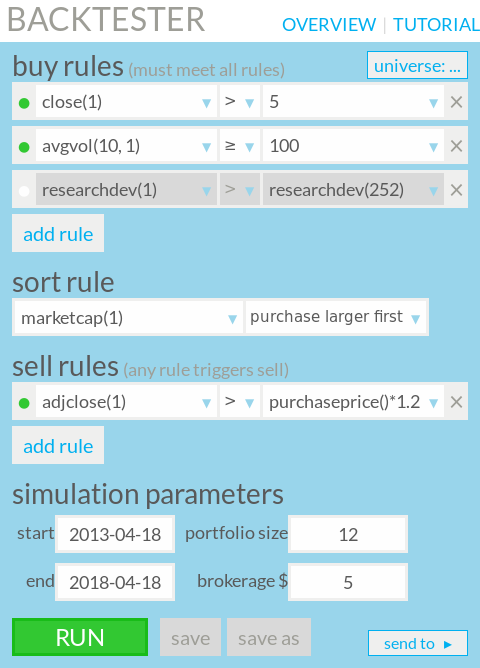
Then, I selected each sector in turn from the "universe" (found in the upper right corner of the blue-box), and ran a backtest with the third rule alternately turned on, and turned off, which you can do by clicking the green circle on the left of each rule. In the picture, you can see the third rule is turned off for demonstration.
It's a very simple strategy: in the selected sector, just buy the largest (by market capitalization) non-penny stocks with enough volume to reliably trade them. The magic comes in the third rule. researchdev(1) > researchdev(252) tells Backtester to only purchase companies that have shown a year-over-year increase in R&D expenditure.
Going through each sector one by one, and turning the third rule on and off, I produced the table below.
| Sector | Sector Performance | With R&D Increase |
|---|---|---|
| Aerospace | 22.98% | 16.35% |
| Auto-Tires-Trucks | 9.68% | 18.04% |
| Basic Materials | 6.22% | 9.62% |
| Business Services | 19.01% | 3.28% |
| Computers and Technology | 14.7% | 17.93% |
| Construction | 5.32% | 1.67% |
| Consumer Discretionary | 7.87% | 18.81% |
| Consumer Staples | 6.35% | -0.5% |
| Finance | 10.26% | 10.67% |
| Industrial Products | 10.75% | 13.01% |
| Medical | 8.08% | 9.42% |
| Multi-Sector Conglomerates | 10.38% | 6.05% |
| Oils-Energy | 2% | 4.97% |
| Retail-Wholesale | 11.19% | 19.86% |
| Transportation | 13.18% | 0.13% |
| Utilities | 6.48% | 5.18% |
Results: surprising!
Wow! We have a few surprises on our hands. Computers and Technology being affected by R&D makes perfect sense to me, but Aerospace being negatively affected is certainly a surprise.
The real money-making insight I'm gathering from this preliminary research indicates that Auto-Tires-Trucks, and Consumer Discretionary are the sectors to look at when creating a strategy around R&D. Different sectors clearly make better use of R&D than others, and these two sectors show the largest boost in performance from R&D spend.
Technical details
It's important to note that not all companies include "Research and Development Expenses" when they report at the end of each quarter. Some companies label it differently, or segment it out into separate categories, and ultimately do not report a standard figure. A good example is General Electric. In such cases, Genovest simply shows R&D expenses as zero, because there is no standard figure for the company. The good news is, this doesn't affect the overall usage of any of our tools. Take the analysis we just did - companies that had no R&D will show no change in R&D and hence, did not make it in to the Backtests.
Furthermore, any backtest is affected by initiation bias, and the time period you run the simulation over. This is just a preliminary exploration of the new data in our system, because new data is fun to play with! A more rigorous analysis would include testing over many time periods and with varied start dates, to mitigate the affects of the overall market and initiation bias.
More green pastures
How would you use R&D with other fundamental metrics to find great stocks? The next thing I'm going to try is putting R&D into its own ratio. revenue(1)/researchdev(1) is intriguing because it shows how well a company turns it's R&D efforts into sales. What about revenue(1)/researchdev(252) to see how well last year's R&D is being turned into current-quarter sales? So much to explore....