The simplest form of Technical Analysis
The Golden Cross is a simple trading strategy based on technical analysis. It uses the "simple moving average" of price to identify when a stock is about to become bullish. At least, that's the idea. Let's take a look at the details of this strategy and see how it holds up to real market data.
Details of the Strategy
The strategy uses two simple moving averages, each with different periods. The example on Investopedia uses 50-day and 15-day averages, and this post from Nasdaq uses 200-day and 50-day averages. I've always liked the 200-day and 50-day variant, so let's start there. The rules are as follows:
- buy a stock when its 50-day average crosses above its 200-day average.
- sell the stock when the 50-day average crosses below the 200-day average.
Nice and simple! Let's visualize this relationship to get a better sense of what price behavior we're looking for.

The green line is the 50-day simple moving average of adjusted close, and the red line is the 200-day average. The blue line is simply adjusted close, which I included because it's a good reference.
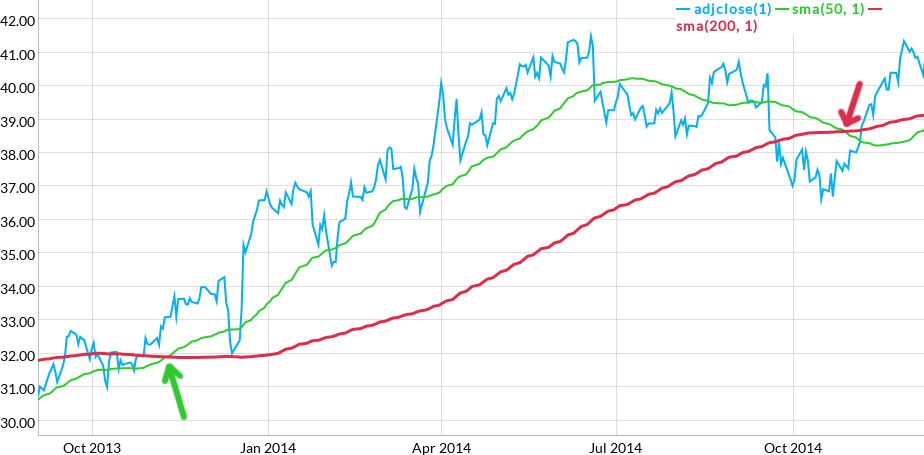
I've annotated the graph with arrows showing when the Golden Cross says to buy, and when to sell. The green arrow points out where the 50-day average crosses above the 200-day average, which says to buy. The red arrow points out where the 50-day average then crosses below the 200-day average, also known as the "Death Cross," which says it's time to sell.
Now that we can see the relationship we're trying to take advantage of, let's see if it holds up against more than just one stock!
Trying it in the Backtester
Given how simple the strategy is to write down, it was straightforward to plug in to the Genovest Backtester.
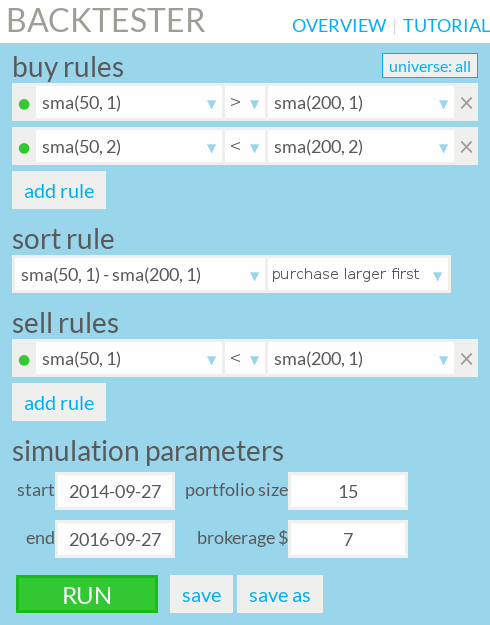
Let's pick apart the rules one by one to see how each embodies an essential part of the Golden Cross strategy.
sma(50, 1) > sma(200, 1)the 50-day average must be greater than the 200-day average using the most recent trading day available.sma(50, 2) < sma(200, 2)the 50-day average muse have been less than the 200-day average the day before. Here, the2in bothsma's is what selects "the day before." This makes sure we purchase at the crossover.sma(50, 1) - sma(200, 1)withpurchase larger firstsimply prefers stocks whose 50-day average is further away from the 200-day average. Many stocks could have met the buy rules, so this prefers stocks who are more clearly showing the Golden Cross pattern.sma(50, 1) < sma(200, 1)sell when the 50-day average crosses below the 200-day average. We're guaranteed to sell at the crossover, because we only purchased if the 50-day was already above the 200-day.
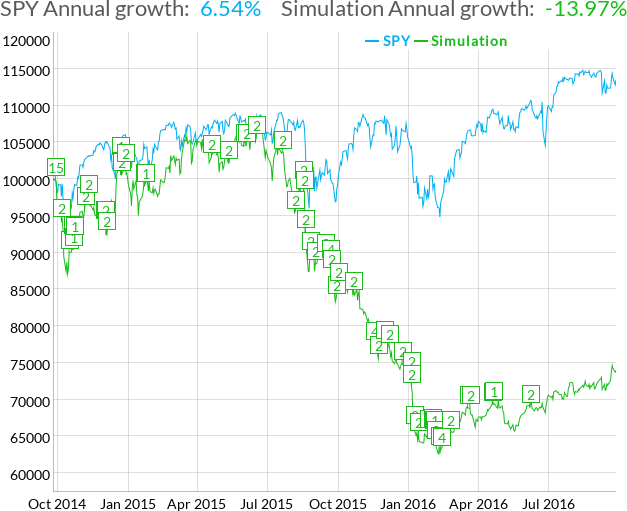
Wow that looks scary! Not only does the strategy loose almost 14% annually, it keeps buying on the way down. Talk about trying to "catch a falling knife." As a matter of fact, I tried this strategy with over a dozen different starting dates throughout 2014 and they all gave negative returns.
This is only a first run, but trading just based on these simple rules seems like a bad idea.
Time to Explore!
Should we abandon this strategy because it's clearly dangerous? Maybe. If you read the articles on Investopedia and Nasdaq from above, you might notice that they mention the buy signal is reinforced by high trading volume. That's definitely something to test!
Here are some other ideas that come to mind:
- Use
volume(1) > volume(10)as a buy rule to add the "high volume" reinforcement. What about usingavgvol? - Use
close(1) > 5as a buy rule to weed out penny stocks. - Sort by
marketcap(1). - Would a ratcheting stop loss like
adjclose(1) > purchaseprice() * 1.2as a sell rule save you from that big downturn? - How about using 15-day and 50-day averages, like Investopedia recommends?
On its own, the Golden Cross leaves much to be desired, but when combined with fundamental indicators that seek out quality companies, it may prove to be a good starting point.