Let me show you something incredible. 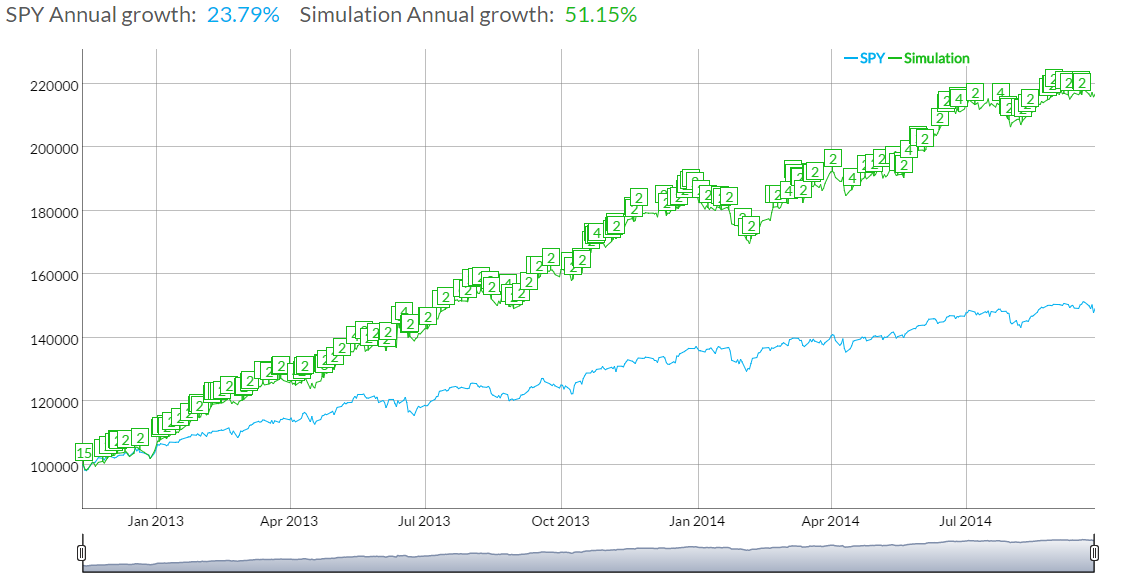
I ran a backtest that started on November 12th, 2013, and ran it all the way to September 26th, 2014. In that time, I got a 51% annual return and could have turned $100,000 into $202,000. Incredible, right? Not so fast. This flashy graph is a bit misleading and the lesson here is that a successful strategy in one market will not necessarily work in every market.
First, we need some historical perspective. 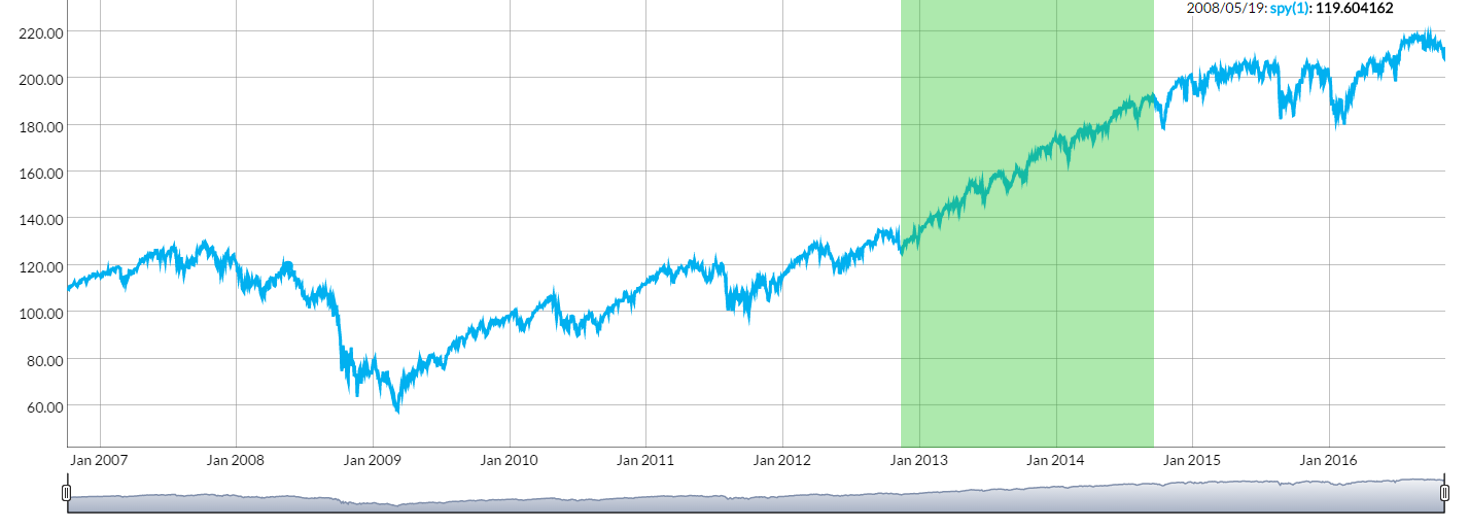
Using our Visualizer tool, the above graph shows 10 years of price history for the S&P500. The time period in green shows the region that I used in the Backtest, which is the strongest period of growth in the S&P in the past 10 years. In this region, the rules I used worked very well.
However, let's see what happens when I use a different region. 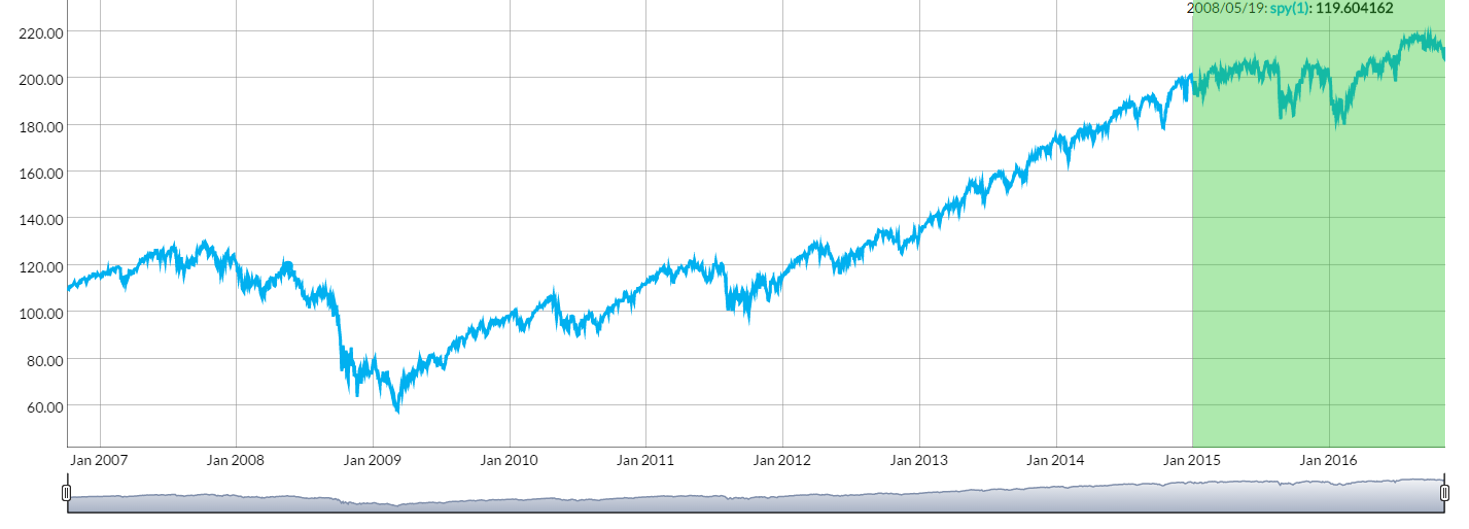
This period of time is significantly more flat and, not surprisingly, we get very different results. 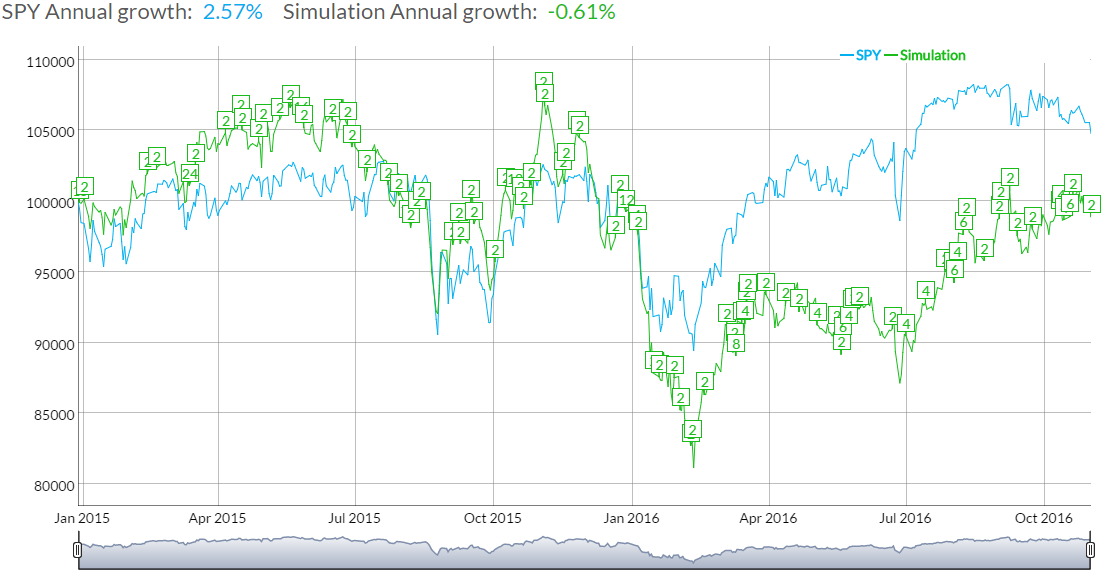
Not terrible compared to the S&P at the same time, but not exactly the wonderful strategy that seemed so promising. That said, depending on the time period we execute our strategy, it can do very well, or completely fall apart.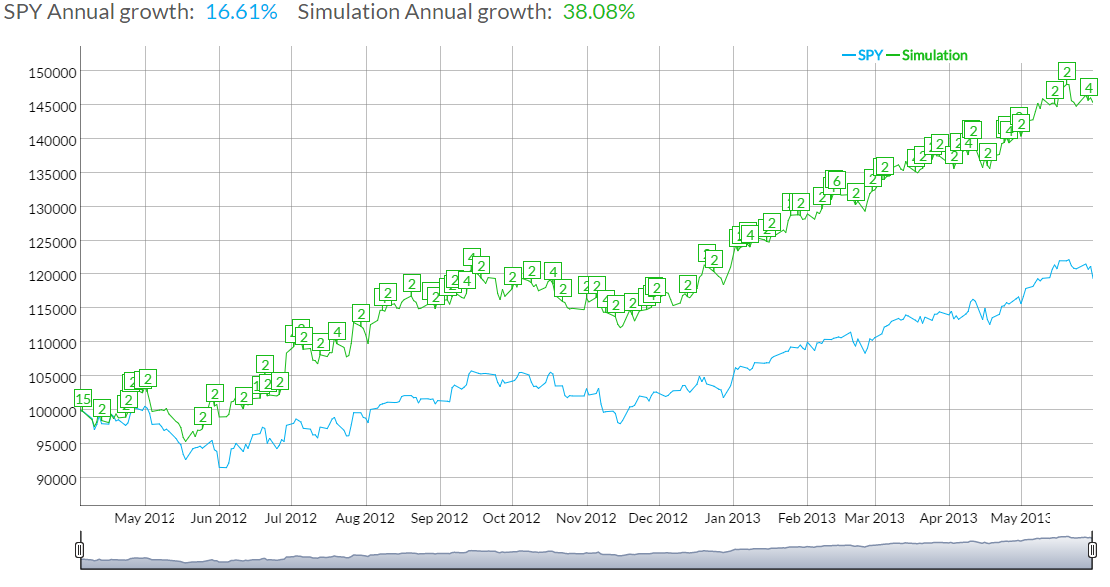
My last graph shows a starting point in a considerably weaker market, which strengthened, weakened, and then recovered nicely. The strategy I used worked well, lending it credibility. To take this concept to the next step, I would try this strategy in many different markets to see if the strategy can handle the rigors of differing market conditions, or over a very long time period. The moral of the story once again: a successful strategy in one market will not necessarily work in every market.