OK, I admit it. Sometimes I just simply play with my tools. Beyond the obvious of trying to find new ways to improve my investment returns, sometimes I come across new ways to use existing ratios. Today, I may have found a decent one.
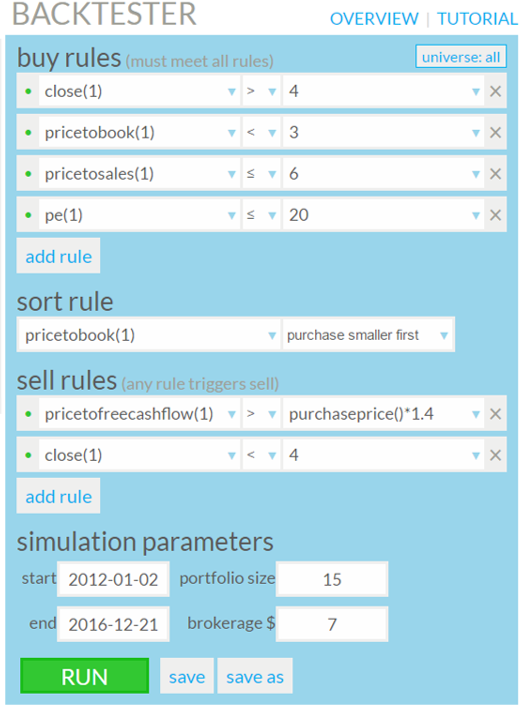
I was researching Market Watch’s Trending Value approach essentially using Price to Book, Price to Sales, Price to Free Cash Flow, and Price to Earnings as my metrics. I initially used ratio limits for each of these that are pretty much recognized as what might be considered “good” from a value approach. Specifically Price to Book less than 3, Price to Sales less than 6, and Price to Free Cash Flow less than 15.
I put these into the Genovest Backtester beginning on January 2nd, 2012 and sorted by Price to Book purchasing the smallest ones first. Market watch was keen on keeping stocks that met these ratios for longer periods so I figured a 5 year time frame would be good. For my sell rules I simply put in a stop loss where if the current closing price was less than 85% of my purchase price the stock was sold. The return was very good at 23.8% with SPY returning 14.88% over the same time period.
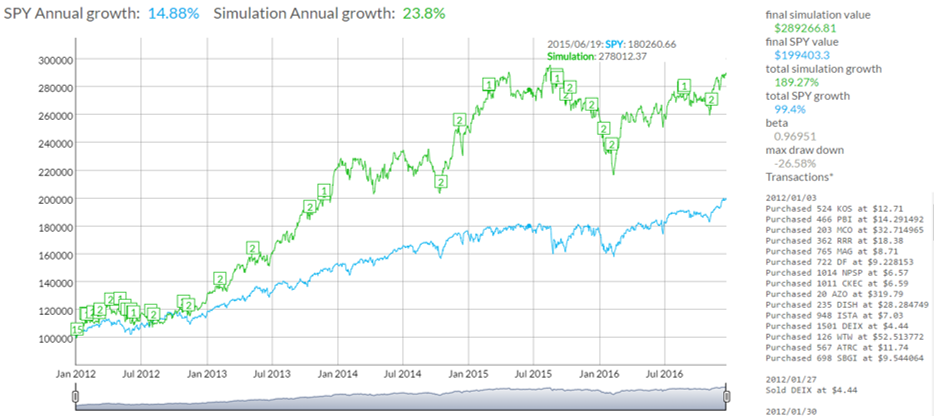
As always however, I wanted to see if I could get more. While the number of transactions on the strategy was low, the max draw down on this was 26.58% so I knew I could improve.
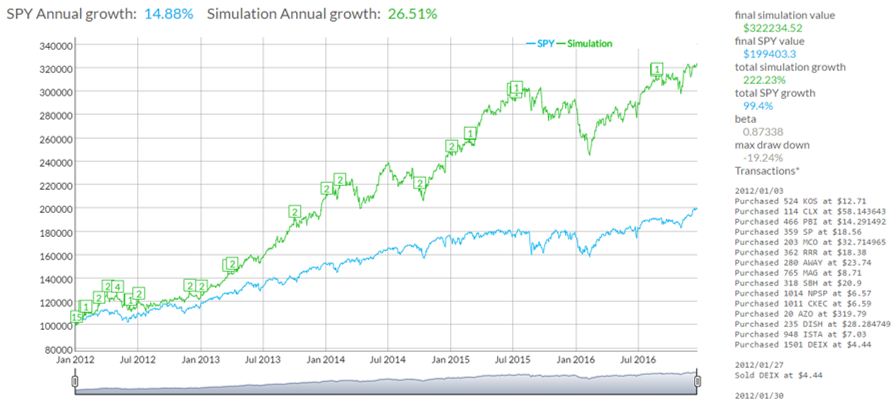
By tinkering with my sell rules things started to get interesting. I removed Price to Free Cash Flow from my purchase criteria and put them into a sell rule formula. I stumbled upon using Price to Free Cash Flow greater than my Purchase Price times 1.40 as a criteria which enabled the strategy to increase it's return to 26.51% and reduce the max draw down to 19.24%.
Below are the final rules I used in the Genovest Backtester.
I had never used this combination before so I thought I better check it out for resiliency. To do this I ran the simulation starting on the first trading day of each month for all of 2012. I then calculated the average return for each of the 12 simulations and compared them to the average for SPY. The strategy beat the return of SPY for 11 of the 12 months of 2012 averaging 17.93% vs SPY's 14.05%. That's a 27.6% increase in return over SPY.
What I make of this is that using Price to Free Cash Flow as a sell criteria in relation to Purchase Price could possibly be used for other Backtesting simulations. It may prove to be a fluke but consistently beating SPY by 27% is definitely worth a second look.