Finding great stocks is the holy grail of stock market investing. With over 7,000 stocks listed on US exchanges plus the volume of information available, both good and bad, a little help can go a long way. That's where a good stock screener comes in.
In essence, a stock screener will allow you to search for companies that meet specific financial criteria that hopefully lead to upward price movement. Testing for this price movement from a stock screen is known as backtesting, but we will cover that in a different post.
Determining what criteria you should use is critical, but again that's another topic. We are just going to cover how to get started using a stock screener. The key is to focus on measurable factors that can affect a stock's price. For our example, we will focus on valuation and financial metrics.
Stocks group up into three major valuation categories; Large Cap (over $10 billion), Mid Cap ($2 billion to $10 billion), and Small Cap ($300 million to $2 billion). There is also a Mega Cap category which is very limited and a Micro Cap category which comes with very high risk, but for most screens, using the first three is usually fine.
Once you determine a desired valuation category, choosing some combination of financial metrics is typically the next step. Momentum is one of the most widely used metrics, which is simply price movement over a specific time period. Another popular metric is P/E or Price to Earning ratio. There are a host of other financial metrics that stock screeners offer but these two can produce excellent results if applied properly.
To demonstrate a typical screen using the above metrics, we will use the Genovest Stock Screener as it is by far the most flexible.
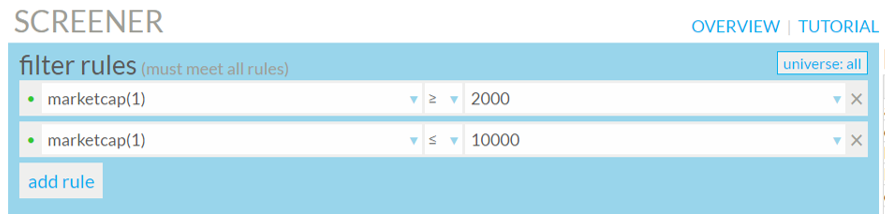
First, let's set our valuation to only Mid Cap companies. Notice we used 2,000 - 10,000 for our numbers as market cap is displayed in millions which is typical of most screeners.
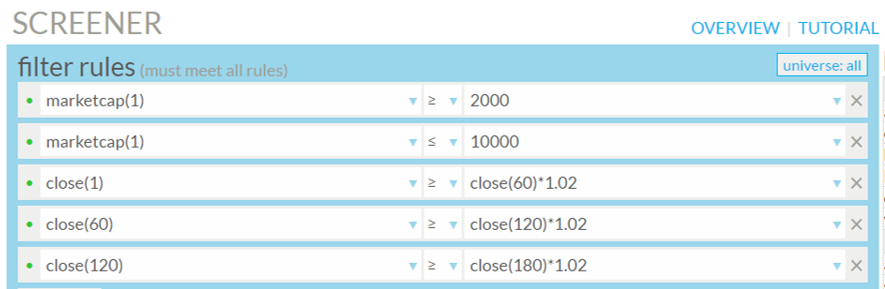
Next, let's set our closing price to have increased by greater than 2% for the past 3 quarters(momentum). Each quarter has approximately 60 trading days so we used 60 day increments for our number of days past.
Lastly, we'll set P/E to less than 12 but greater than 3 to rule out negative or really low P/E stocks.
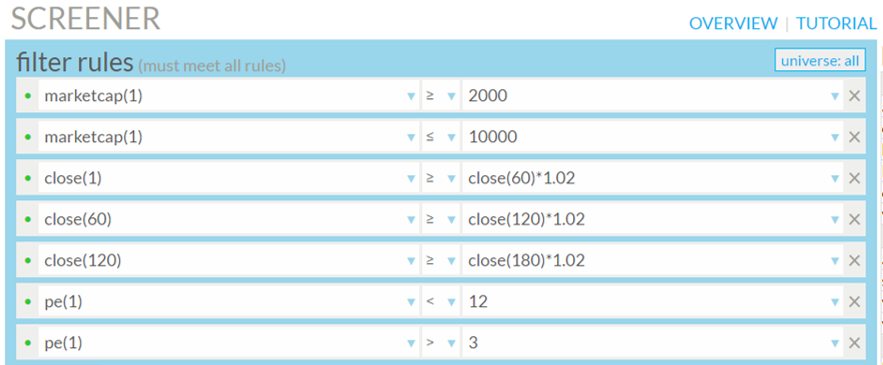
This builds a simple but powerful screen. We will only get Mid Cap stocks that have appreciated in price by at least 2% over the last three quarters whose Price to Earnings ratio is below 12.
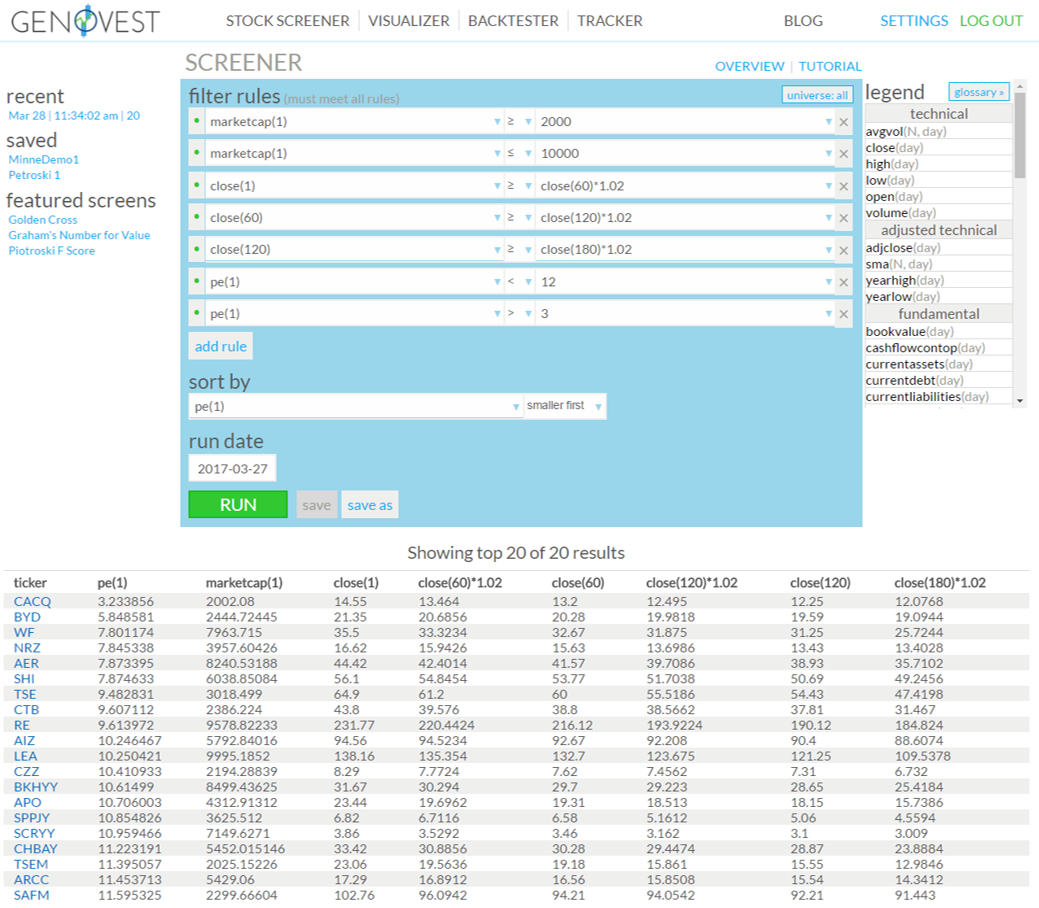
Running this screen in the Genovest Screener returns 20 stocks that have met all of our criteria. This is an important point. After a screen in run, further research should be done to determine which stocks to potentially purchase. A screen that returns hundreds of stocks is not as useful due to the time requirement for further research. Conversely, a screen that returns only one or two stocks is most likely too restrictive by not allowing enough selection. Here are the results of this screen.
Obviously this is just a beginning to understanding stock screeners. With all of the available combinations, the possibilities are nearly endless. Knowing which criteria to use, understanding your own preference for the types of stocks you want to invest in and then testing the results of your selections should all be prominent in the process.
There are several decent stock screeners available for free or a small fee. Genovest, MSN Money, FinViz, and Yahoo Finance are some of the most useful. While we are biased to the Genovest Screener as it is by far the most powerful, any stock screener can be used as a time saving tool for finding great stocks.