On every income statement, revenue sits front and center. It's one of the most important metrics for a company and one that determines the success or downfall of any firm. Common thought suggests that if a company has increasing revenue, their profits and stock price should follow suit. Let's dig into that statement and see if it holds water.
Using a stock backtester, we can examine this theory.
Buy Rules
First, let's put a general price floor at $5 so that we're not trading any stocks below $5. 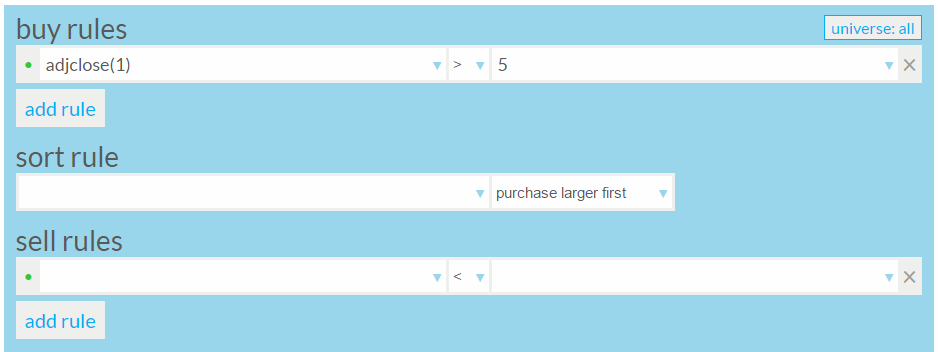
Next we'll start adding rules about revenue. Since we want to indicate steadily increasing revenue, we will set the revenue today to be greater than it was 50 days ago. 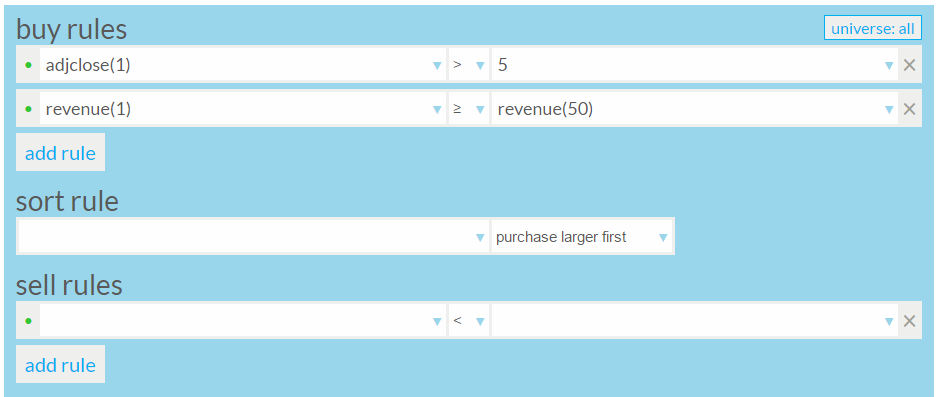
Now, one period of increasing revenue doesn't always mean things are going well for the company. We want more than that, so let's add two more rules that show increasing revenue over each successive time period.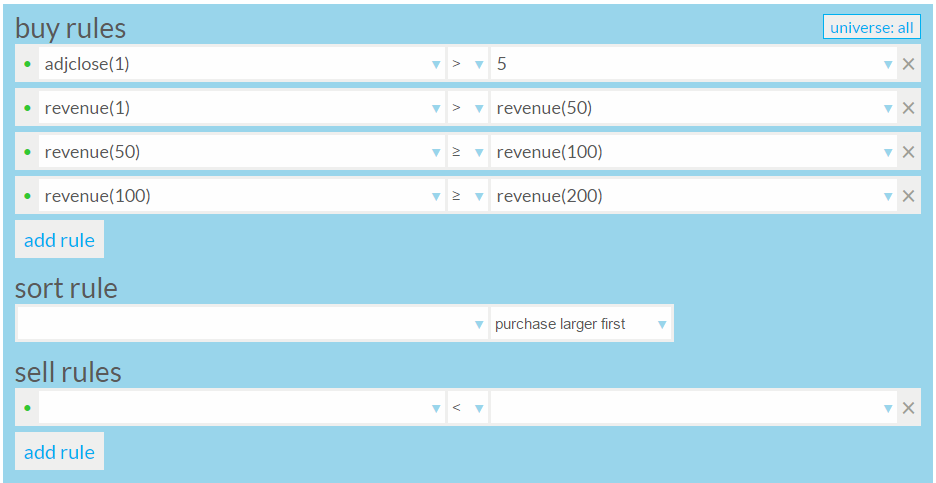
This is a good start for buy rules.
Sort Rule
Since we're dealing with revenue, let's initially set the sort for purchases by something tied to revenue, such as eps. I'll sort it to purchase larger first.
Sell Rules
For this strategy, we'll sell as soon we see a period of decreasing revenue. In this case we'll set it to the same 50 days we used in the buy rules. 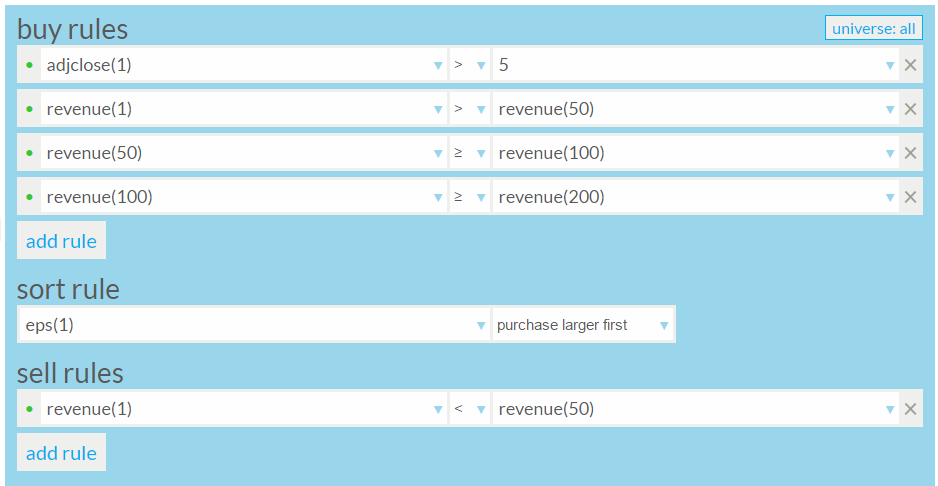
First Run
Remember, this is an unproven strategy based off of a theory, but that's why backtesters exist: to test and vet your theories. Since we were using the Genovest Backtester, we left the simulation parameters unchanged with respect to run dates, portfolio size, and commissions. 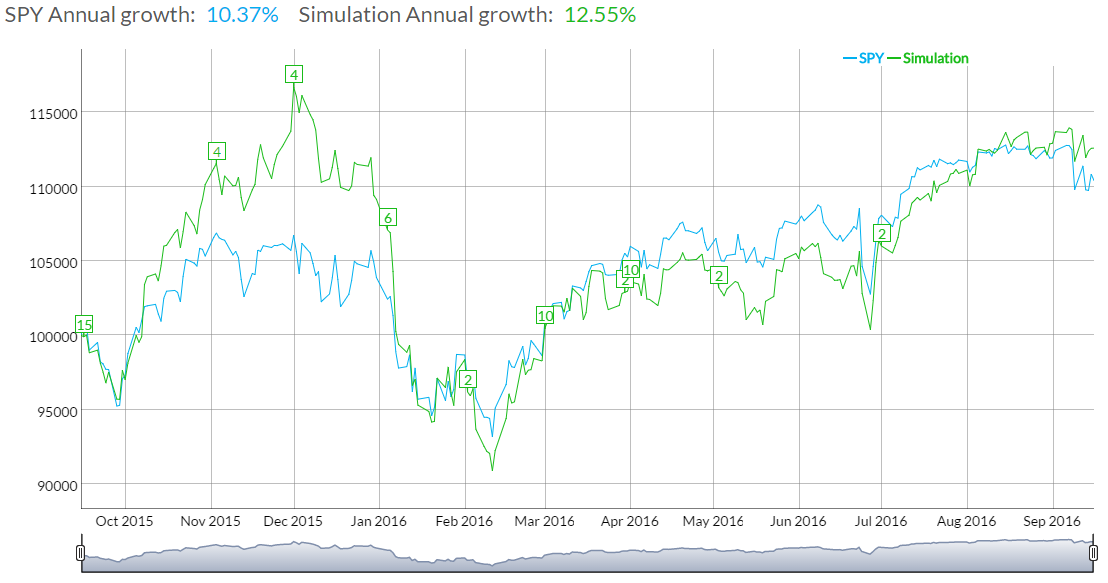
Well, that's not bad, but it's not great - 12% vs the market at 10%. We can do better and it's easy to make adjustments.
Adjustments
There are a few things that stand out as large knobs to turn in our theory that we could change to make this a more successful strategy.
- price floor (set at $5)
- buy rule metric time period (initially set at 50 days)
- sell rule metric time period (also 50 days)
- sort rule metric (related to revenue)
At the moment, let's try changing the sell rule time period since kicking stocks out for one bad 50 day streak after three good ones seems a bit harsh. Let's jump up to 150 days and see what that gets us.
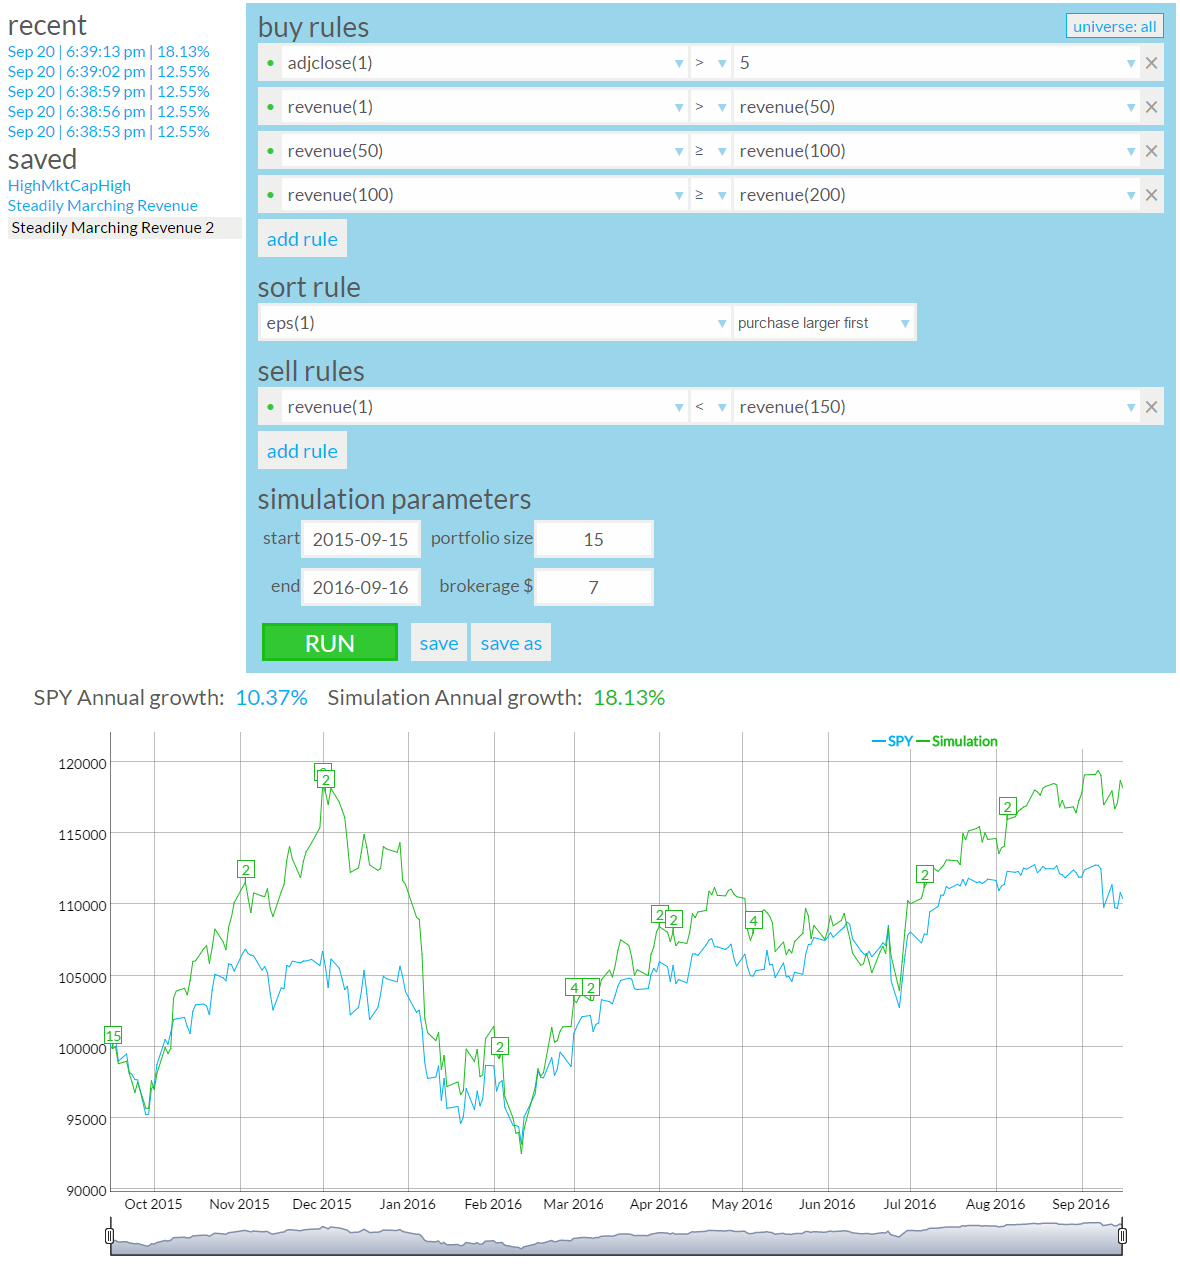 Hey, 18% isn't bad at all! Okay, so that's better, but now perhaps we're thinking more about the nature of these companies and we wonder what kind of companies would do best with 3 consecutive periods of revenue. Specifically, would larger or smaller companies do better?
Let's use marketcap to filter companies below a certain threshold of size and we'll start with the idea that a smaller company might be more successful at establishing momentum than a large one. For this, picking a value that gives a good result may take some time. Starting with 500 (million) and working up from there, the sweet spot happened at 50000 (million).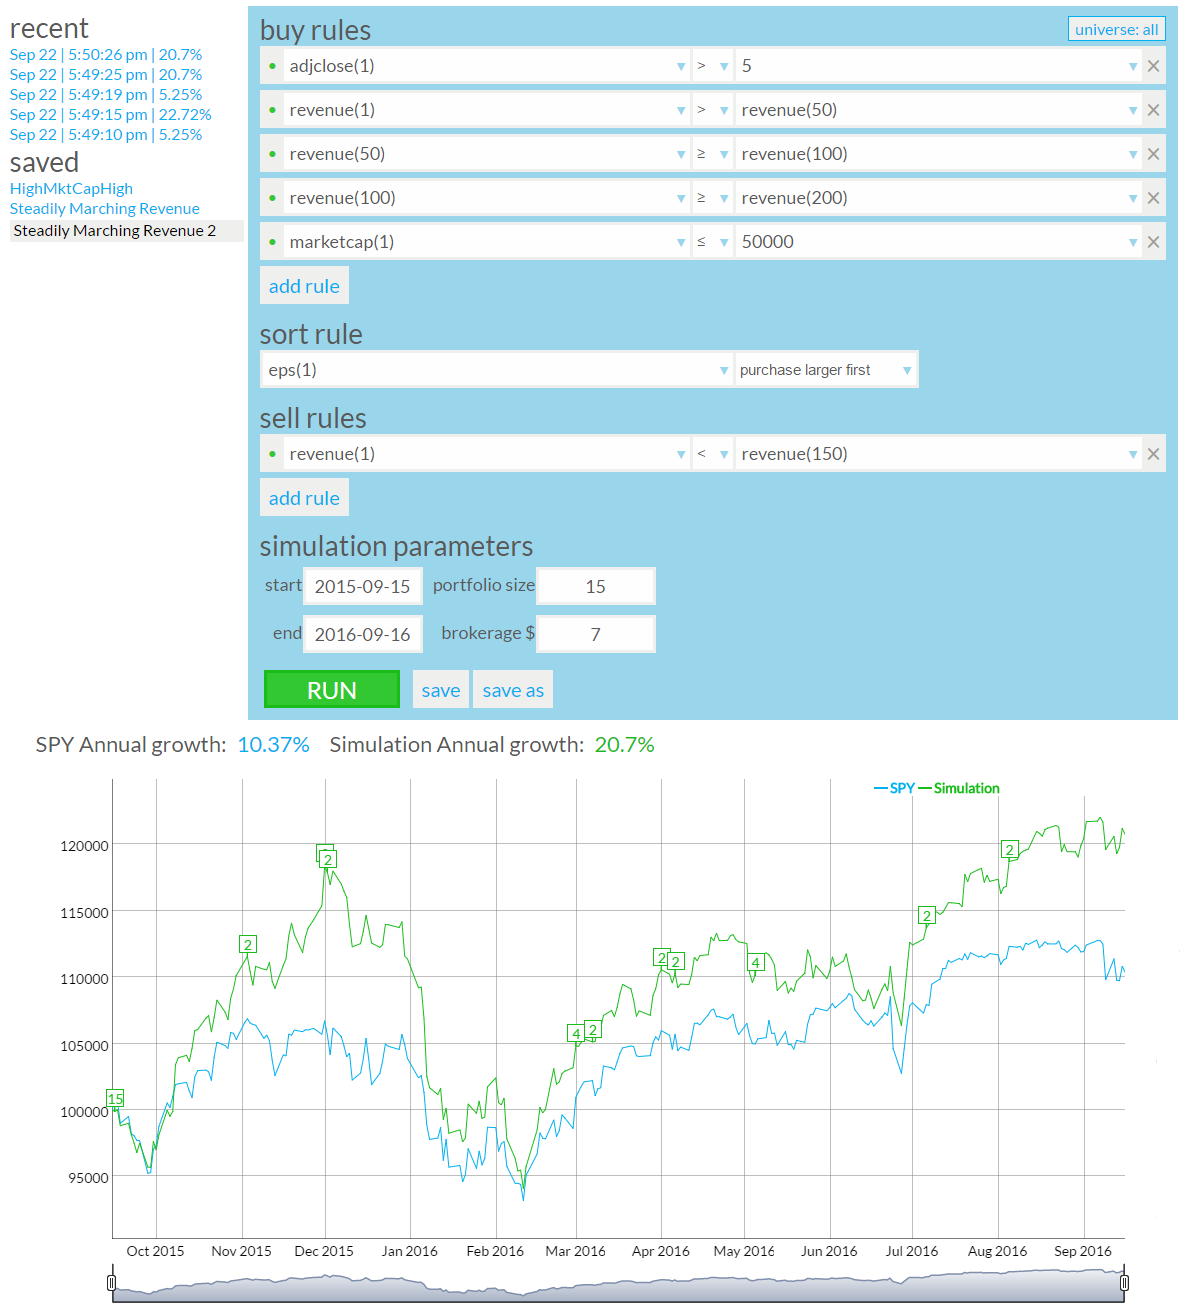
Now we've cracked above 20% and that's a pretty good return especially considering it's nearly double the Standard & Poor's 500 ETF "SPY".
Theory
In this case, the theory proved to hold some truth. A summary statement for this strategy could be as follows: Select larger (but not too large) stocks that have steadily increasing revenue and sell them once revenue to drops over a sustained time period.
Keep in mind that this strategy is far from finished. For one thing, it's not tested in different time periods, and the numbers for revenue comparison haven't been played with. But that's the nature of developing strategies - there are always opportunities for experimentation.
Hopefully this gives a good starting point for future strategies and shows that there is some truth to steadily increasing revenue resulting in stock price appreciation beyond the general market.